Python数据科学手册(第2版,影印版)
出版时间:2023年03月
页数:563
“这本新鲜出炉的新版提供了清晰易懂的示例,帮助你顺利地设置和使用基本的数据科学和机器学习工具。”
——Anne Bonner
Content Simplicit的创始人兼首席执行官
Python是众多研究人员眼中的一流工具,主要原因在于它所提供的可用于存储、操作、洞察数据的各种库。数据科学堆栈的各个部分都存在多种资源,但只有本书的新版将它们汇集于一处,包括IPython、NumPy、pandas、Matplotlib、Scikit-Learn以及其他相关工具。
熟悉阅读和编写Python代码的在职科技人员和数据处理人员会发现这份全面的案头参考书的第2版非常适用于处理各种日常问题:数据的操作、转换、清理;不同类型数据的可视化;使用数据建立统计或机器学习模型。一句话,这是Python科学计算的必备参考书。
你将从此手册中学到:
● IPython和Jupyter,为使用Python的科技人员提供计算环境
● NumPy,包括用于高效存储和操作密集数据数组的ndarray
● Pandas,提供了用于高效存储和操作标记/列数据的DataFrame
● Matplotlib,包括一系列灵活的数据可视化功能
● Scikit-Learn,帮助你构建最重要和最成熟的机器学习算法的高效简洁的Python实现
- Preface
- Part I. Jupyter: Beyond Normal Python
- 1. Getting Started in IPython and Jupyter
- Launching the IPython Shell
- Launching the Jupyter Notebook
- Help and Documentation in IPython
- Keyboard Shortcuts in the IPython Shell
- 2. Enhanced Interactive Features
- IPython Magic Commands
- Input and Output History
- IPython and Shell Commands
- 3. Debugging and Profiling
- Errors and Debugging
- Profiling and Timing Code
- More IPython Resources
- Part II. Introduction to NumPy
- 4. Understanding Data Types in Python
- A Python Integer Is More Than Just an Integer
- A Python List Is More Than Just a List
- Fixed-Type Arrays in Python
- Creating Arrays from Python Lists
- Creating Arrays from Scratch
- NumPy Standard Data Types
- 5. The Basics of NumPy Arrays
- NumPy Array Attributes
- Array Indexing: Accessing Single Elements
- Array Slicing: Accessing Subarrays
- Reshaping of Arrays
- Array Concatenation and Splitting
- 6. Computation on NumPy Arrays: Universal Functions
- The Slowness of Loops
- Introducing Ufuncs
- Exploring NumPy’s Ufuncs
- Advanced Ufunc Features
- Ufuncs: Learning More
- 7. Aggregations: min, max, and Everything in Between
- Summing the Values in an Array
- Minimum and Maximum
- Example: What Is the Average Height of US Presidents?
- 8. Computation on Arrays: Broadcasting
- Introducing Broadcasting
- Rules of Broadcasting
- Broadcasting in Practice
- 9. Comparisons, Masks, and Boolean Logic
- Example: Counting Rainy Days
- Comparison Operators as Ufuncs
- Working with Boolean Arrays
- Boolean Arrays as Masks
- Using the Keywords and/or Versus the Operators &/|
- 10. Fancy Indexing
- Exploring Fancy Indexing
- Combined Indexing
- Example: Selecting Random Points
- Modifying Values with Fancy Indexing
- Example: Binning Data
- 11. Sorting Arrays
- Fast Sorting in NumPy: np.sort and np.argsort
- Sorting Along Rows or Columns
- Partial Sorts: Partitioning
- Example: k-Nearest Neighbors
- 12. Structured Data: NumPy’s Structured Arrays
- Exploring Structured Array Creation
- More Advanced Compound Types
- Record Arrays: Structured Arrays with a Twist
- On to Pandas
- Part III. Data Manipulation with Pandas
- 13. Introducing Pandas Objects
- The Pandas Series Object
- The Pandas DataFrame Object
- The Pandas Index Object
- 14. Data Indexing and Selection
- Data Selection in Series
- Data Selection in DataFrames
- 15. Operating on Data in Pandas
- Ufuncs: Index Preservation
- Ufuncs: Index Alignment
- Ufuncs: Operations Between DataFrames and Series
- 16. Handling Missing Data
- Trade-offs in Missing Data Conventions
- Missing Data in Pandas
- Pandas Nullable Dtypes
- Operating on Null Values
- 17. Hierarchical Indexing
- A Multiply Indexed Series
- Methods of MultiIndex Creation
- Indexing and Slicing a MultiIndex
- Rearranging Multi-Indexes
- 18. Combining Datasets: concat and append
- Recall: Concatenation of NumPy Arrays
- Simple Concatenation with pd.concat
- 19. Combining Datasets: merge and join
- Relational Algebra
- Categories of Joins
- Specification of the Merge Key
- Specifying Set Arithmetic for Joins
- Overlapping Column Names: The suffixes Keyword
- Example: US States Data
- 20. Aggregation and Grouping
- Planets Data
- Simple Aggregation in Pandas
- groupby: Split, Apply, Combine
- 21. Pivot Tables
- Motivating Pivot Tables
- Pivot Tables by Hand
- Pivot Table Syntax
- Example: Birthrate Data
- 22. Vectorized String Operations
- Introducing Pandas String Operations
- Tables of Pandas String Methods
- Example: Recipe Database
- 23. Working with Time Series
- Dates and Times in Python
- Pandas Time Series: Indexing by Time
- Pandas Time Series Data Structures
- Regular Sequences: pd.date_range
- Frequencies and Offsets
- Resampling, Shifting, and Windowing
- Example: Visualizing Seattle Bicycle Counts
- 24. High-Performance Pandas: eval and query
- Motivating query and eval: Compound Expressions
- pandas.eval for Efficient Operations
- DataFrame.eval for Column-Wise Operations
- The DataFrame.query Method
- Performance: When to Use These Functions
- Further Resources
- Part IV. Visualization with Matplotlib
- 25. General Matplotlib Tips
- Importing Matplotlib
- Setting Styles
- show or No show? How to Display Your Plots
- 26. Simple Line Plots
- Adjusting the Plot: Line Colors and Styles
- Adjusting the Plot: Axes Limits
- Labeling Plots
- Matplotlib Gotchas
- 27. Simple Scatter Plots
- Scatter Plots with plt.plot
- Scatter Plots with plt.scatter
- plot Versus scatter: A Note on Efficiency
- Visualizing Uncertainties
- 28. Density and Contour Plots
- Visualizing a Three-Dimensional Function
- Histograms, Binnings, and Density
- Two-Dimensional Histograms and Binnings
- 29. Customizing Plot Legends
- Choosing Elements for the Legend
- Legend for Size of Points
- Multiple Legends
- 30. Customizing Colorbars
- Customizing Colorbars
- Example: Handwritten Digits
- 31. Multiple Subplots
- plt.axes: Subplots by Hand
- plt.subplot: Simple Grids of Subplots
- plt.subplots: The Whole Grid in One Go
- plt.GridSpec: More Complicated Arrangements
- 32. Text and Annotation
- Example: Effect of Holidays on US Births
- Transforms and Text Position
- Arrows and Annotation
- 33. Customizing Ticks
- Major and Minor Ticks
- Hiding Ticks or Labels
- Reducing or Increasing the Number of Ticks
- Fancy Tick Formats
- Summary of Formatters and Locators
- 34. Customizing Matplotlib: Configurations and Stylesheets
- Plot Customization by Hand
- Changing the Defaults: rcParams
- Stylesheets
- 35. Three-Dimensional Plotting in Matplotlib
- Three-Dimensional Points and Lines
- Three-Dimensional Contour Plots
- Wireframes and Surface Plots
- Surface Triangulations
- Example: Visualizing a Mobius Strip
- 36. Visualization with Seaborn
- Exploring Seaborn Plots
- Categorical Plots
- Example: Exploring Marathon Finishing Times
- Further Resources
- Other Python Visualization Libraries
- Part V. Machine Learning
- 37. What Is Machine Learning?
- Categories of Machine Learning
- Qualitative Examples of Machine Learning Applications
- Summary
- 38. Introducing Scikit-Learn
- Data Representation in Scikit-Learn
- The Estimator API
- Application: Exploring Handwritten Digits
- Summary
- 39. Hyperparameters and Model Validation
- Thinking About Model Validation
- Selecting the Best Model
- Learning Curves
- Validation in Practice: Grid Search
- Summary
- 40. Feature Engineering
- Categorical Features
- Text Features
- Image Features
- Derived Features
- Imputation of Missing Data
- Feature Pipelines
- 41. In Depth: Naive Bayes Classification
- Bayesian Classification
- Gaussian Naive Bayes
- Multinomial Naive Bayes
- When to Use Naive Bayes
- 42. In Depth: Linear Regression
- Simple Linear Regression
- Basis Function Regression
- Regularization
- Example: Predicting Bicycle Traffic
- 43. In Depth: Support Vector Machines
- Motivating Support Vector Machines
- Support Vector Machines: Maximizing the Margin
- Example: Face Recognition
- Summary
- 44. In Depth: Decision Trees and Random Forests
- Motivating Random Forests: Decision Trees
- Ensembles of Estimators: Random Forests
- Random Forest Regression
- Example: Random Forest for Classifying Digits
- Summary
- 45. In Depth: Principal Component Analysis
- Introducing Principal Component Analysis
- PCA as Noise Filtering
- Example: Eigenfaces
- Summary
- 46. In Depth: Manifold Learning
- Manifold Learning: “HELLO”
- Multidimensional Scaling
- Nonlinear Manifolds: Locally Linear Embedding
- Some Thoughts on Manifold Methods
- Example: Isomap on Faces
- Example: Visualizing Structure in Digits
- 47. In Depth: k-Means Clustering
- Introducing k-Means
- Expectation–Maximization
- Examples
- 48. In Depth: Gaussian Mixture Models
- Motivating Gaussian Mixtures: Weaknesses of k-Means
- Generalizing E–M: Gaussian Mixture Models
- Choosing the Covariance Type
- Gaussian Mixture Models as Density Estimation
- Example: GMMs for Generating New Data
- 49. In Depth: Kernel Density Estimation
- Motivating Kernel Density Estimation: Histograms
- Kernel Density Estimation in Practice
- Selecting the Bandwidth via Cross-Validation
- Example: Not-so-Naive Bayes
- 50. Application: A Face Detection Pipeline
- HOG Features
- HOG in Action: A Simple Face Detector
- Caveats and Improvements
- Further Machine Learning Resources
- Index
书名:Python数据科学手册(第2版,影印版)
作者:Jake VanderPlas 著
国内出版社:东南大学出版社
出版时间:2023年03月
页数:563
书号:978-7-5766-0658-4
原版书书名:Python Data Science Handbook, 2nd Edition
原版书出版商:O'Reilly Media
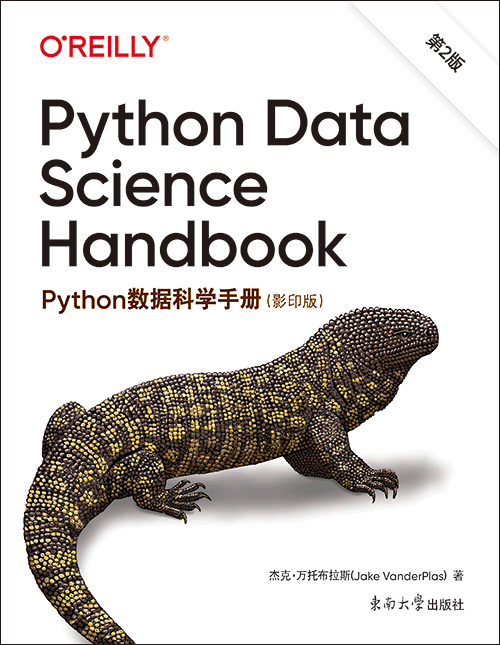
The animal on the cover of Python Data Science Handbook is a Mexican beaded lizard (Heloderma horridum), a reptile found in Mexico and parts of Guatemala. The Greek word heloderma translates to “studded skin,” referring to the distinctive beaded texture of the lizard’s skin. These bumps are osteoderms, which each contain a small piece of bone and serve as protective armor.
The Mexican beaded lizard is black with yellow patches and bands. It has a broad head and a thick tail that stores fat to help it survive the hot summer months when it is inactive. On average, these lizards are 22–36 inches long, and weigh around 1.8 pounds. As with most snakes and lizards, the tongue of the Mexican beaded lizard is its primary sensory organ. It will flick it out repeatedly to gather scent particles from the environment and detect prey (or, during mating season, a potential partner).
It and the Gila monster (a close relative) are the only venomous lizards in the world. When threatened, the Mexican beaded lizard will bite and clamp down, chewing, because it cannot release a large quantity of venom at once. This bite and the aftereffects of the venom are extremely painful, though rarely fatal to humans. The beaded lizard’s venom contains enzymes that have been synthesized to help treat diabetes, and further pharmacological research is in progress. It is endangered by loss of habitat, poaching for the pet trade, and locals who kill it out of fear. This animal is protected by legislation in both countries where it lives.
购买选项
|
© 2026,奥莱利技术咨询(北京)有限公司。版权所有。 传真: +86-10-88097463 京ICP备05003502号 |
|